
Can Process Mining be applied to Customer Behavior Analysis?
Su Chul Park| Jan 16 2023| 10 min read
The Challenges of Customer Behavior Analysis and Rediscovering Process Mining
In traditional customer behavior analysis, when creating a Customer Journey Map (CJM), one could only think in a fragmented and experiential manner. Here, being fragmented and experiential means that one had to base the customer’s journey on subjective experiences, defining, “Customers will behave this way when using our product,” and thus, limiting their thinking regarding customer behavior.
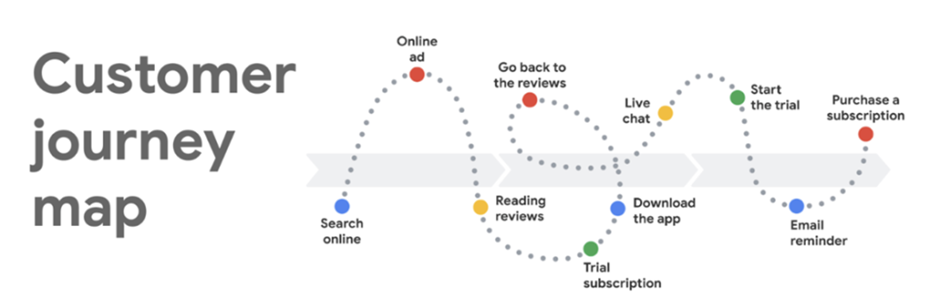
Source – https://www.coursera.org/learn/foundations-of-digital-marketing-and-e-commerce
As mentioned above, the traditional CJM would typically be drawn as shown earlier. However, using such a CJM as a basis for judgment would limit one’s ability to consider aspects outside of the defined stages, making it challenging to see the customer journey flow in detail, and confining thinking to a series of steps.
Therefore, in recent times, UX departments within companies have been contemplating how to refine the traditional CJM and view it from various perspectives. Consequently, there is a growing trend of companies seeking to address this need through the adoption of a methodology called “process mining.”
Since process mining is a discipline that initially stemmed from workflow management, it may still be relatively unfamiliar from the perspective of customer behavior analysis. Moreover, customer behavior is challenging to generalize, as each customer may have a different journey, making it difficult to group multiple customer journeys. In practice, if you were to use process mining solutions to create maps from unrefined customer behavior log data, you might end up with complex maps like the one below:
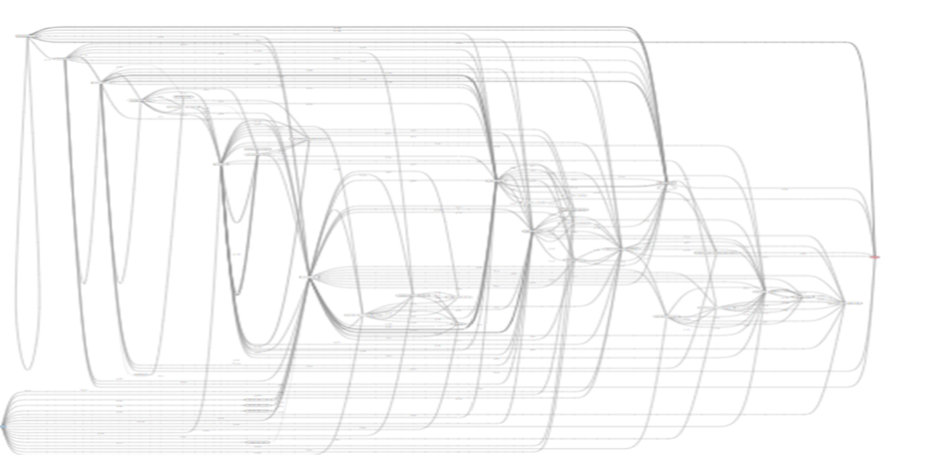
The map obtained by uploading the unrefined customer behavior logs to Pro Discovery
However, by defining the analysis topic and extracting customer data relevant to that topic while selecting Core Activities*, customer behavior analysis using process mining can be performed relatively easily.
*Core Activity: Key customer actions selected during the customer behavior log refinement stage that are relevant to the analysis topic.
e.g., Instead of analyzing all pages visited by customers, focus only on essential pages like login, settings, and personal information changes (selected according to the analysis topic), excluding unnecessary logs.
As mentioned, when visualizing the registration process using the process mining methodology, the resulting CJM would look like the diagram below:
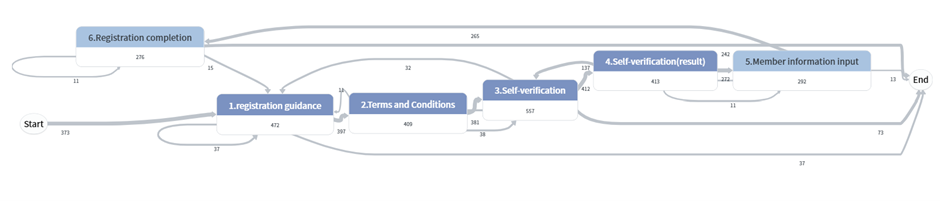
Using a Frequency Based Map to Visualize the Registration Process
(Frequency Based Map Interpretation: Visualizes the flow of the process based on frequency, primarily focusing on the mainstream. The thickness of the pathways represents the volume of cases flowing through that path, and the intensity of color at each step indicates the time taken for that step.)
Interpreting the Frequency-Based Map reveals that after entering the registration process, there is a direct pathway to the endpoint after 1) registration guidance and 3) self-verification. This indicates a significant dropout rate at these stages. The repetition between 1) registration guidance and 3) self-verification, as well as the reversal from 4) self-verification (result) to 3) self-verification, suggests the possibility of users failing the self-verification and reverting to the previous stage. Additionally, it is evident from the varying shades of nodes that users spend a relatively long time in the user information input and self-verification stages.
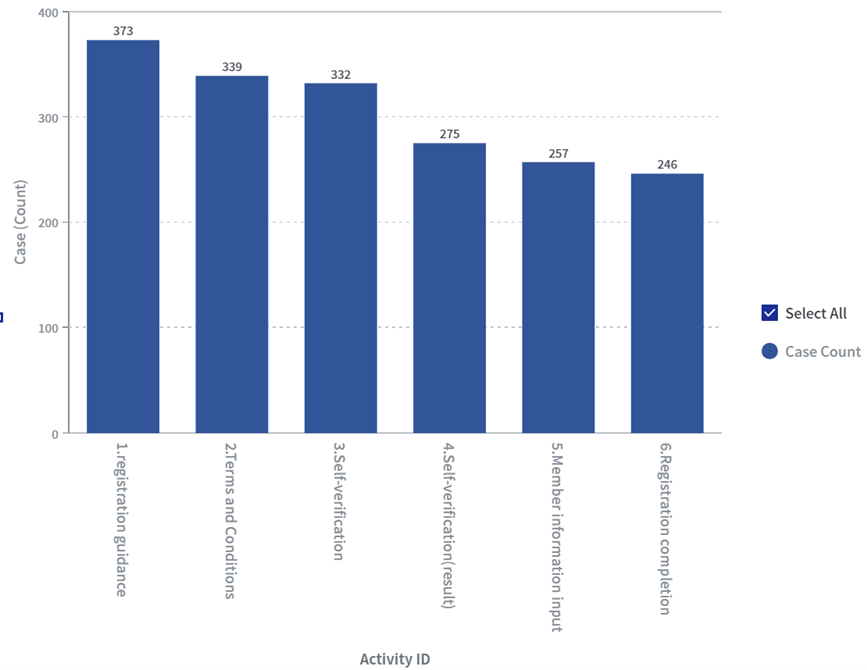
Number of customers entering each stage
When examining the actual number of customers entering each stage, it becomes evident that there is a significant drop-off after the third stage compared to the previous stages. This suggests that there is a notable pain point at this stage. Therefore, this specific stage can be considered a pain point where customer attrition is notably high. Having discovered that many customers struggle with self-verification at this point, you may consider making changes to the page to make it more user-friendly or exploring options to diversify the methods of self-verification if they are limited. This way, you can think of potential improvements to the customer experience process to reduce attrition and enhance user satisfaction.
When you examine the number of customers entering each stage, you can observe a significant drop-off after the third stage compared to the previous stages. This highlights a substantial pain point at this particular stage. Consequently, you can consider this stage as a critical pain point where customer attrition is notably high. Having identified that many customers struggle with self-verification at this point, you may want to make changes to the page to enhance its user-friendliness. Additionally, if there is a limited variety of methods for self-verification, you could explore adding diverse options. These actions can be part of your efforts to improve the customer experience process, reduce attrition, and enhance overall customer satisfaction.
Next, we will examine the process patterns.
* Here, patterns refer to a kind of footprint derived based on the sequence of activities that customers have performed.
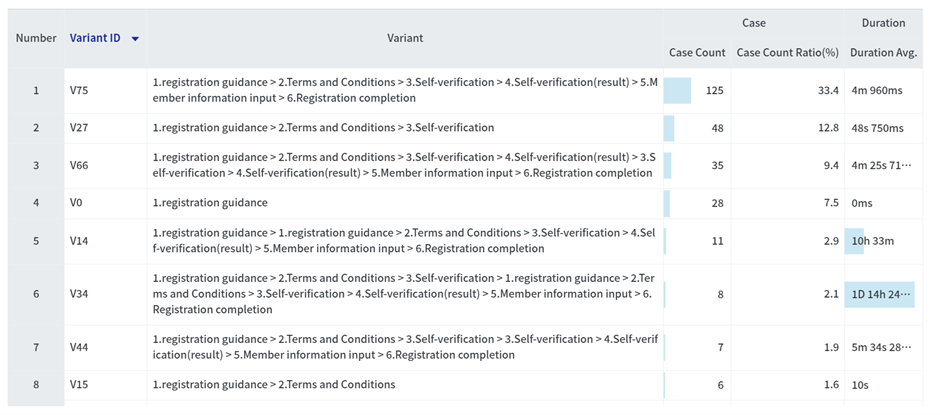
Registration Process Pattern List
When examining the top patterns (customer behavior patterns), it’s expected that the most prevalent pattern, accounting for the highest proportion, aligns with the ideal pattern envisioned by the planners of the registration process. On average, customers take around 4 minutes to complete the registration process in this top pattern.
The second-ranked pattern suggests that customers tend to drop off after the self-verification stage. The third-ranked pattern indicates customers who faced difficulties during the self-verification process but eventually completed the registration. The fourth-ranked pattern represents customers who immediately exit after entering the process. Finally, the fifth-ranked pattern reveals a group of customers who initially enter the registration guidance page, then exit, and later return to ultimately complete the registration. These customers likely took an average of around 10 hours to return, considering the top-ranked pattern.
If there is an intention to encourage customers who are likely to return after an initial exit, this data provides a numerical basis for recommending that inducement offers should be made within 10 hours to be more effective.
The benefit of examining the process pattern list is that it provides a more intuitive view of the patterns and their associated numerical data compared to the frequency-based map, which focuses on the overall flow. This allows for a more direct and insightful understanding of the customer behavior patterns. With this information, you can explore different approaches to managing and marketing to customers based on specific patterns.
Next, let’s examine the time distribution for each activity for completed registrations.
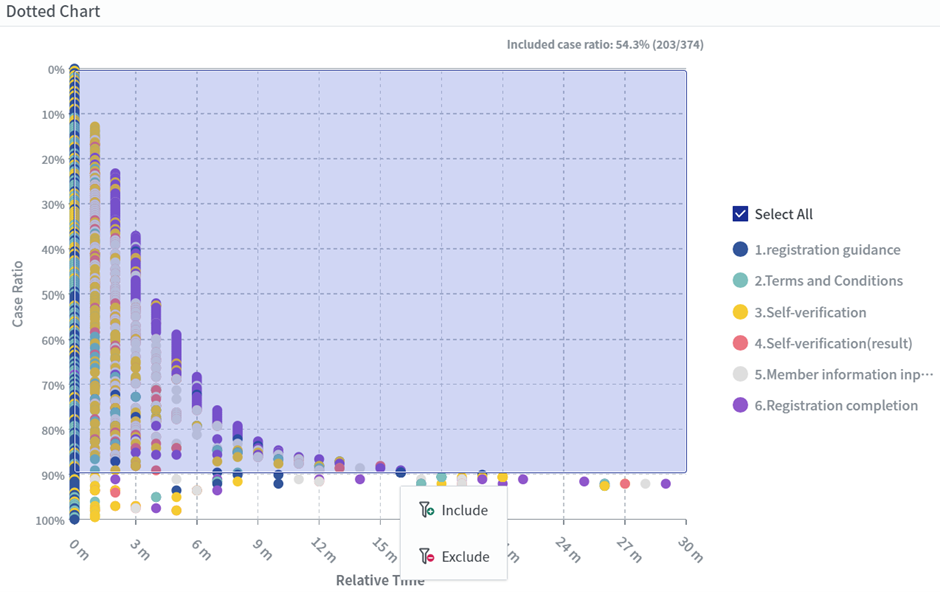
Activity-Based Time Distribution for Completed Registrations
(Interpreting the Dotted Chart: Consider the series of dots as representing coordinates along a horizontal axis, from left to right (starting with Step 1, registration guidance, and ending with Step 6, registration completion) over time. The x-coordinate of the far-right point represents the final completion time, with 0m (minutes) marking the starting point at Step 1 (registration guidance). For example, customers located around the y-axis at 50% have completed Steps 1 to 6 in approximately 5 minutes.)
It’s evident that customers entering the registration process complete it within 10 minutes, with approximately 90% of customers finishing within this time frame. However, there are some customers who take nearly 30 minutes to complete the process. This observation highlights the variance in the time it takes for customers to complete the registration process.
Utilizing process mining for customer behavior analysis provides a fresh perspective and the opportunity to discover new insights. Process mining has been proven effective in various industries such as manufacturing, healthcare, and finance for uncovering previously unseen patterns and points of interest. I hope you find valuable insights through the analysis using process mining techniques with ProDiscovery.