
Three approaches to analyzing purchase process lead time
Hyewan Kim |May 2 2022|11 min read
In the process of analysis, we gain valuable business insights through numerous comparative analyses, and by establishing sound principles for selecting the right analysis targets using critical metrics such as lead time, we can enter the journey of this analysis more easily and quickly.
(1) Using Core KPIs for Process Management
Have you ever experienced the feeling of being overwhelmed by the multitude of metrics and variables that pour out of data when you start an analysis? How can you focus on the necessary data and systematically proceed with the analysis?
I’d like to explore ideas for process management centered around a commonly used Key Performance Indicator (KPI) in processes, which is “lead time.” Following the efforts of Mr. Puzzle, who is responsible for improving the “purchase process” at a mobile device manufacturing company, let’s summarize three perspectives suitable for various situations.
Question
Mr. Puzzle is interested in having the purchasing process, especially the process of procuring materials, managed based on data. In a preliminary interview, there was a need for supplier management, and the question was formulated as, “When managing purchase orders, which suppliers should be emphasized in the purchase process?”
Breaking Down Sentences and Finding Data
Let’s start by breaking down the question derived from the real world into specific data-level components. Here, ‘suppliers’ is one of several attribute variables, and it’s crucial to obtain data containing information about the attributes of interest for analysis. Additionally, as the purchase process unfolds, there may be associated attributes obtained. These attributes may include the foll∙owing:
| ∙Purchase materials ∙Related Product Items ∙Purchasing personnel |
So, what criteria should be used to select and manage the suppliers that are considered problematic? The “value” that you want to determine in this context is referred to as a Key Performance Indicator (KPI). In Mr. Puzzle’s case, he has chosen “lead time,” which is the total execution time from the start to the completion of a single purchase order, as the KPI to use.
To calculate lead time, it’s essential to have a predefined process. Mr. Puzzle has defined the tasks related to the process he wants to examine and has secured data recorded in the system. For future process mining, he identifies a unique “case” by assigning a series of numbers that are given when a single order is issued. In other words, for each case, a lead time value is calculated.
| Purchase Order Issuance→(Purchase Order Modification and Reissuance→) Delivery Note Generation → Material Receipt |
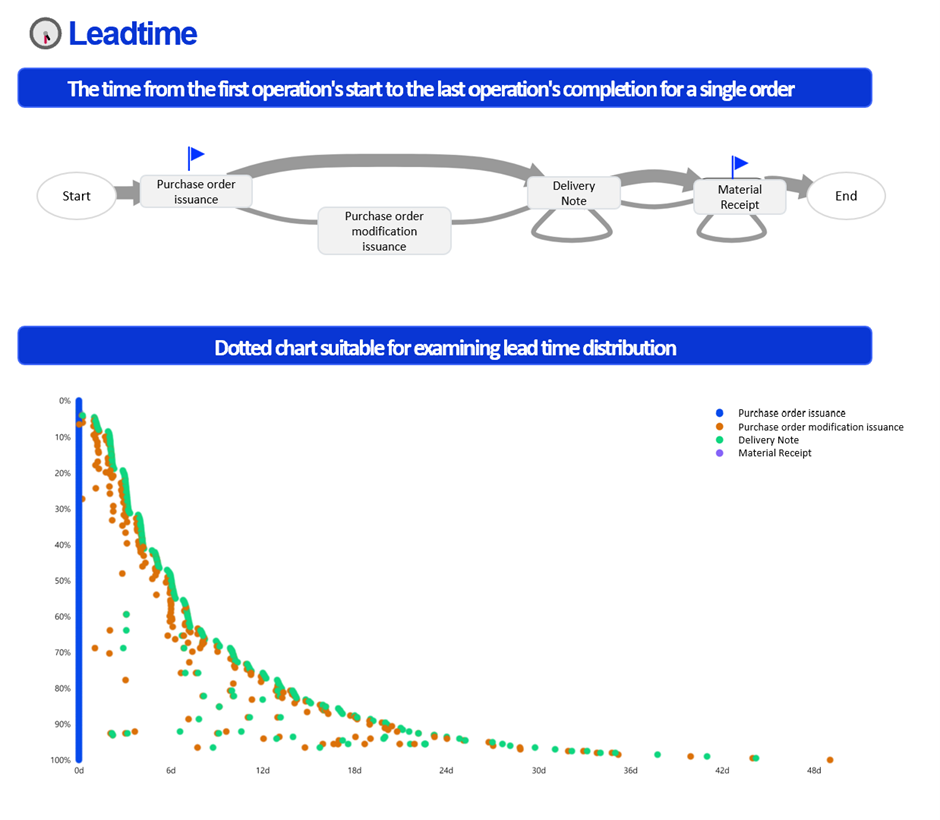
The definition of efficient lead time varies depending on the industry and the stage of the process. Here, let’s assume a market environment where the product life cycle is getting shorter, and demand volatility is gradually increasing. The goal is to reduce supply lead times to quickly respond with minimal inventory.
Analyzing Data
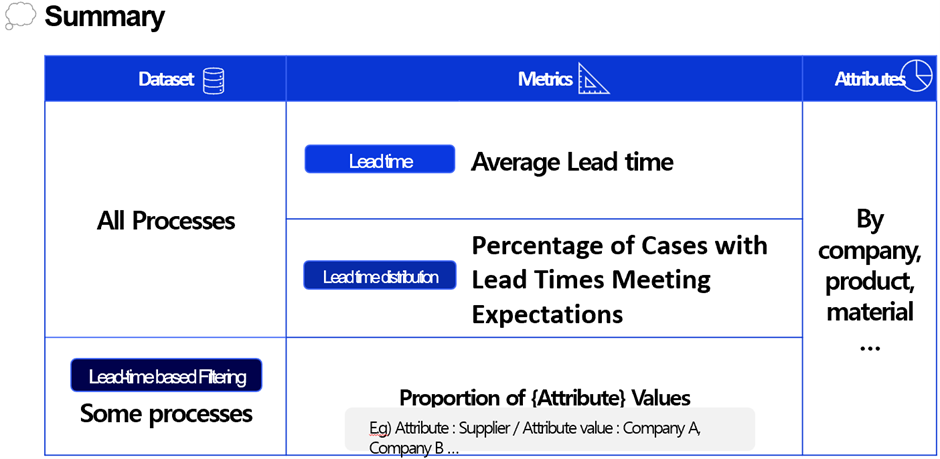
Lead time is a metric that can be calculated on its own. In other words, it’s an index. We can calculate lead time using various numerical values (such as average, standard deviation, etc.) and use these values for different purposes. We can also visualize these values as a distribution to better understand them. Furthermore, we can use lead time as a criterion for filtering datasets based on specific conditions.

(2) How to select the ‘supplier with the longest lead time’ or the ‘supplier with a poor lead time distribution’?
Q1. How to identify the ‘supplier with the longest lead time’?
Mr. Puzzle first calculates the average lead time for all purchase orders handled by each supplier. After obtaining these average values, they can arrange them in descending order to identify the supplier with the longest lead time, which in this case would be the G supplier.
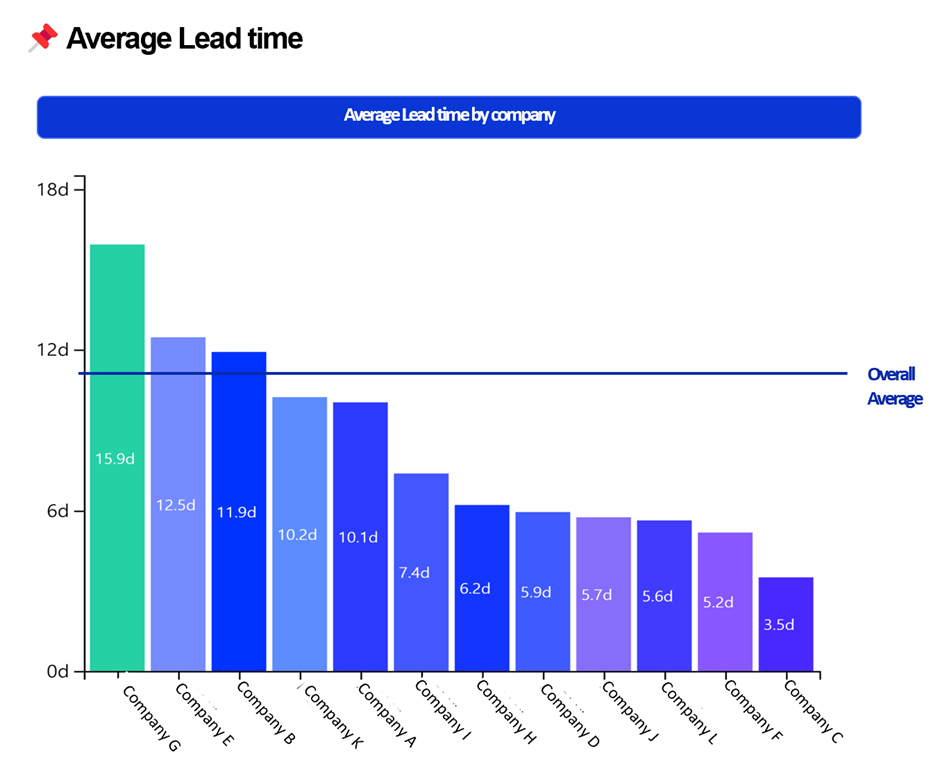
However, as Mr. Puzzle continued with the analysis, they noticed that the average lead time was influenced by a few specific purchase orders with excessively long lead times. Due to this observation, Mr. Puzzle decided to reconsider their selection criteria for identifying the supplier with the longest lead time.
Q2. How to identify ‘supplier with lead time delays’ taking into account the lead time distribution?
The first approach may make it difficult to assess the lead time distribution characteristics of many purchase orders handled by each supplier. To address this, Mr. Puzzle decided to select their targets based on the lead time distribution for each supplier.
To examine the distribution, there are various methods, but Mr.Puzzle decided to particularly focus on 3-month and 1-month intervals, which are significant in their field. This approach involves separately managing cases where the lead time for each order exceeds one quarter (3 months) or goes beyond the 1-month deadline, ensuring they capture extended lead times that may be problematic.
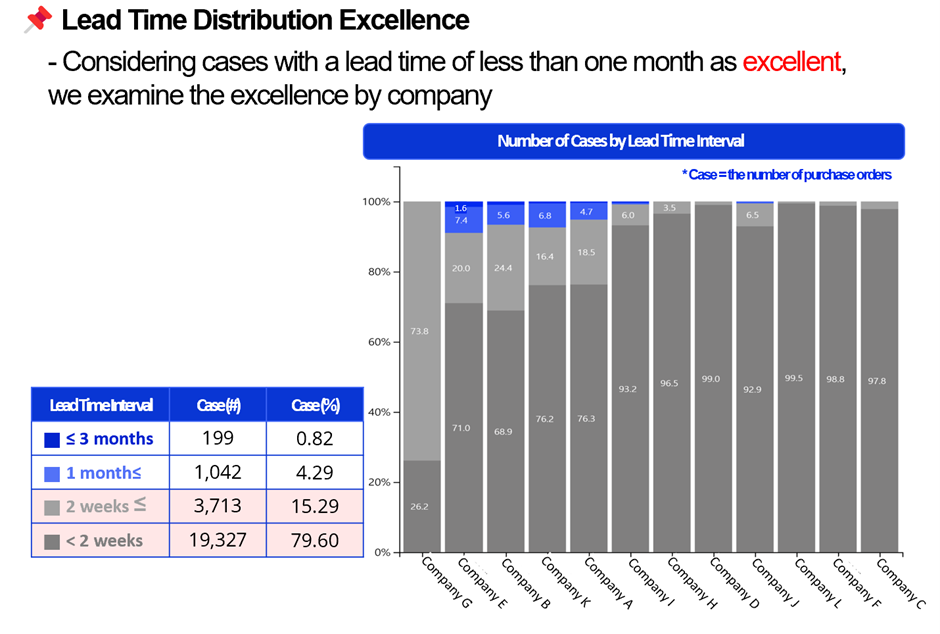
Mr. Puzzle first categorized each order case into different intervals and organized them into a table. For example, out of all the orders, there are 201 cases where the lead time exceeds 3 months.
For orders with a lead time of less than 1 month, they considered the possibility of further analysis and differentiated whether the lead time is ‘within 2 weeks’ or ‘more than 2 weeks but less than 1 month.’
Next, they visualized the percentage of orders falling into each interval for each supplier using a 100% stacked bar chart. For example, within supplier E, orders with lead times exceeding 3 months account for 1.6%, and those with lead times of 1 month or more but less than 3 months make up 7.4%. This indicates that the supplier’s lead time performance is relatively poor.
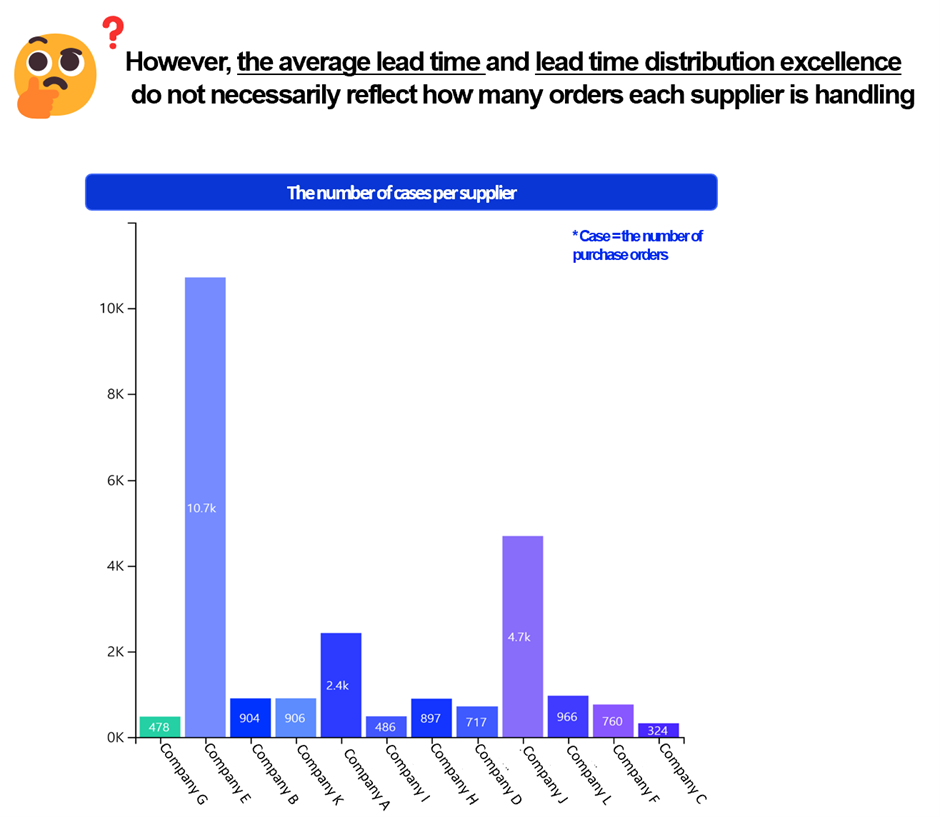
However, Mr. Puzzle realized that there are significant differences in the number of orders per supplier and started to consider whether it’s possible to select the analysis targets while taking these aspects into account.
(3) How to focus on selecting suppliers with ‘excessively delayed lead time cases’?
Q3. How to focus on selecting suppliers with ‘excessively delayed lead time cases’?
The previous two perspectives focused on selecting suppliers based solely on the lead time metric, regardless of the quantity of purchase orders handled by each supplier.
How can we select suppliers while also taking into account the scale of order volumes?
In this context, we are using a subset of the dataset that concentrates on cases where lead times exceed a certain threshold, leaving out cases that don’t meet this specific lead time criterion.
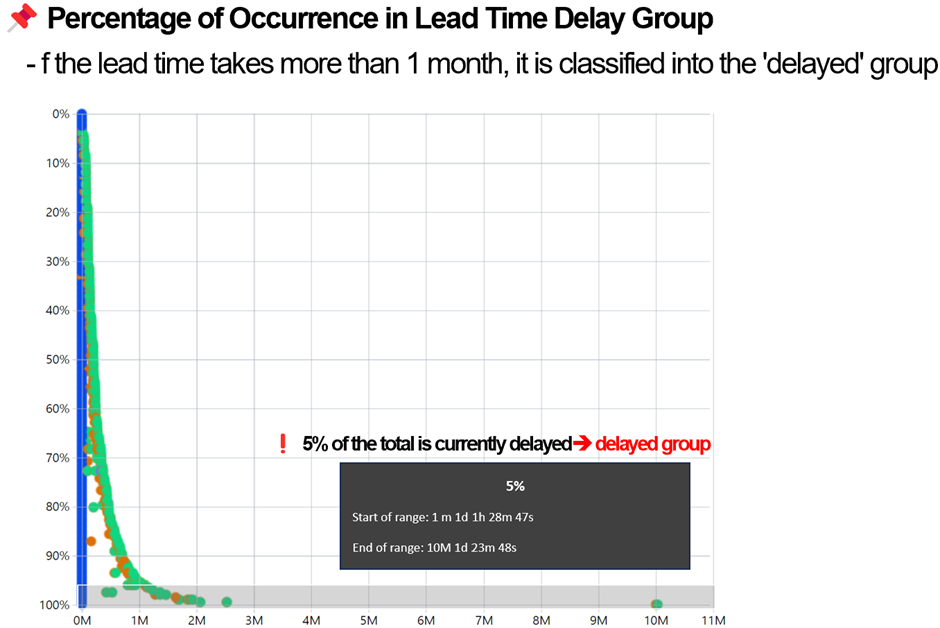
Using a Dotted Chart, I created a dataset by filtering out cases where the lead time exceeds 1 month. In other words, it’s a dataset that includes only orders with delayed lead times, accounting for approximately 5% of the total data. (*A Dotted Chart: A visualization chart where all cases are listed vertically in order of lead times, with each row representing one case).
Now, let’s examine which suppliers handle a significant number of orders within the ‘lead time delay group’ using a Pie Chart puzzle.
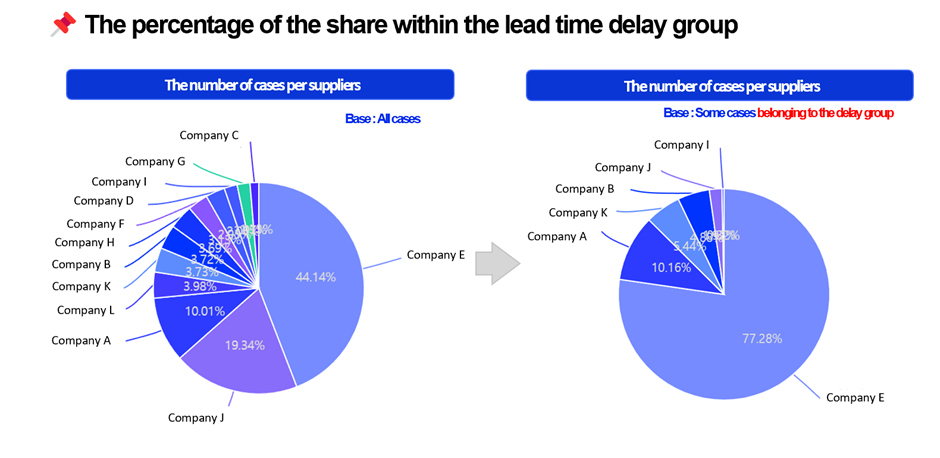
Company E’s dominance with around 77% of the share is quite overwhelming. This supplier not only has a less favorable lead time distribution but also handles the highest number of orders, making this situation even more pronounced.
Two other notable suppliers are Company A and Company J.
Company A, with a share of approximately 10%, represents the second-largest portion. Although it falls into the group of four suppliers with less favorable lead time distribution (Q2), its average lead time (Q1) ranks fifth, which is close to the overall average. Moreover, Company A handles the third-highest number of orders. Taking all these factors into account, it has been selected as the second-ranked supplier with a 10% share in this approach.
On the other hand, Company J, despite having the second-largest order volume, has a 2% share and ranks fifth. This is because its average lead time (Q1) is ninth, but its lead time distribution (Q2) is good. Such suppliers may be better suited for maintenance and improvement rather than being flagged as a priority for immediate attention.
These insights should help in prioritizing and managing suppliers based on their performance and order volume in the ‘lead time delay group.’
The Benefits of Efficiently Selecting Analysis Targets
“It is preferable to provide approximate answers to the right questions rather than precise answers to vague questions.”
Mathematician John Tukey
In the process of analysis, we gain valuable business insights through numerous comparative analyses. Comparison methods can involve comparing whole to part, past to present, or units with different attribute values (e.g., Company A vs. Company B).
Before conducting these comparisons, the first step is to answer the question of “what” and “what” we are comparing. If we establish sound principles for selecting the right analysis targets using critical metrics such as lead time, we can enter the journey of this analysis more easily and quickly.
Process Mining and Lead Time
In process management, lead time is a key metric that must be addressed, and process mining offers an advanced approach to effectively analyze and manage lead time. Process mining visualizes processes in an easy-to-understand manner, going beyond individual isolated cases to derive process models for the entire process.
In essence, with a perspective on ‘patterns’ derived from the results of process mining, it is possible to identify targets with lead time issues. Furthermore, if you are contemplating subsequent actions after selecting the targets, you can efficiently uncover improvement points based on process mining results that reveal where bottlenecks occur in specific tasks.”