
What is Process Simulation and How Does It Work?
Sunghee Kim | Mar 21, 2022 | 10 min read
Process simulation is a technique used to model and mimic the behavior of a real-world process over time. In this article, we’ll delve into “Discovering simulation models” (Rozinat et al. 2009), which explores the intricacies of constructing process simulation models and their pivotal role in process improvement. By the end, you’ll grasp the methodology for information extraction to build such models and understand how ProDiscovery’s simulation feature can facilitate what-if analyses for process redesign.
Overview
Simulation analysis and process mining are intricately connected in the realm of process improvement. Process mining provides the historical context and raw data needed to understand how processes currently operate. The figure below is an overview of the process mining techniques discussed in the paper. For simplicity, the blue section represents the methodology for process simulation model discovery, and the red section shows how the models are used for process redesign.
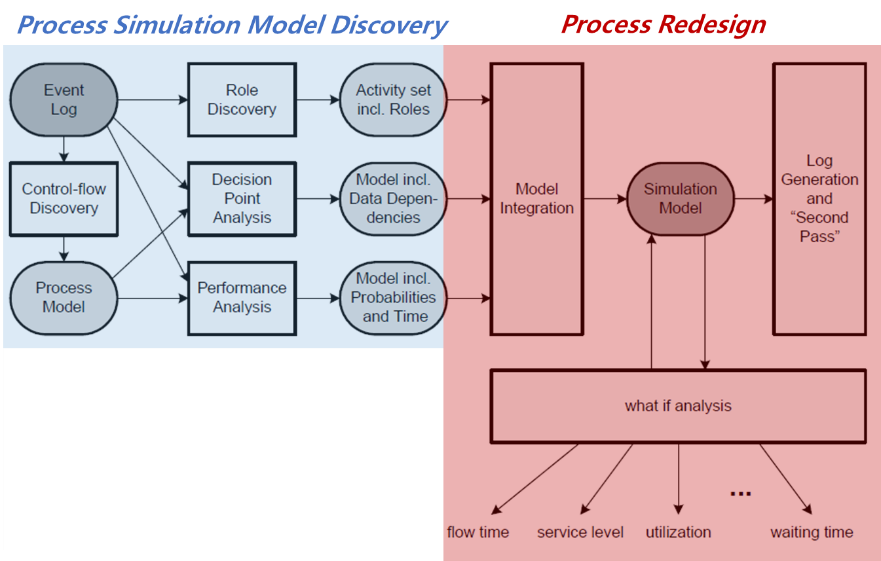
Fig. 1. Process Simulation Model Methodology Framework
How to Build a Process Simulation Model
Discovering a process simulation model involves extracting various types of information from event logs using algorithms based on four perspectives: control-flow discovery, decision point analysis, performance analysis, and role discovery. Let’s look at each perspective in detail.
- Control-flow discovery
Control-flow focuses on the chronological sequence of tasks, automatically deriving a process model from event logs. The authors use the α-algorithm, the simplest algorithm for extracting process models based solely on the ordering relations from the event log.
Figure 2 illustrates an example of process model discovery from event logs using the α-algorithm on outpatient clinic data.
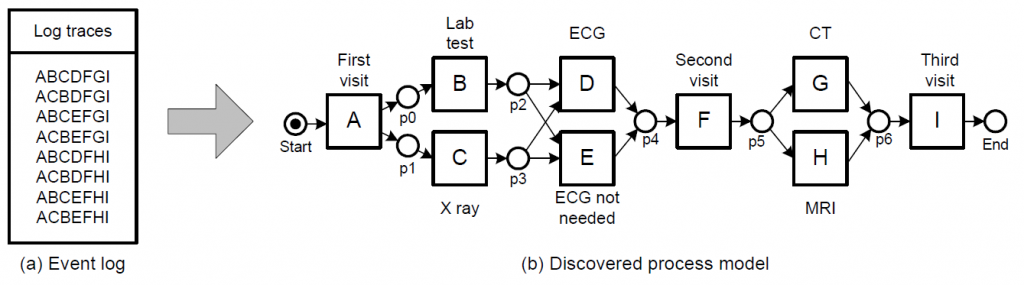
Fig. 2. Example of control-flow discovery of outpatient clinic process model using α-algorithm
- Decision point analysis
Decision point analysis is about determining rules for decision points within the derived process model. Decision points refer to spots where the process can go in different directions. Imagine it like a fork in the road; you can choose one path or another. For instance, in Figure 2, after Task B, either Task D or Task E can occur, making “p2” a decision point.
The authors classify each subsequent task of a decision point as a class and the process of grouping them as a classification problem. For example, Figure 3(a) shows the list of cases for decision point “p2,” classifying subsequent tasks D and E into two classes based on patient attributes like ASA (anesthesia risk), diagnosis, and age. These attributes serve as independent variables, while class is the predictive variable for training a decision tree.
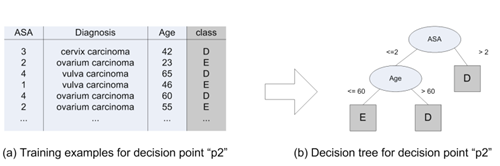
Fig. 3. Derivation of decision tree for decision point “p2”
The decision tree for decision point “p2” shown in Figure 3(b) defines the following rules. If ASA is greater than 2, or if ASA is less than or equal to 2 and Age is greater than 60, it is classified as D. If ASA is less than or equal to 2 and Age is less than or equal to 60, it is classified as E. Similarly, for all decision points, we can create decision trees and derive rules. When we incorporate these rules into the process model, it looks like Figure 4.
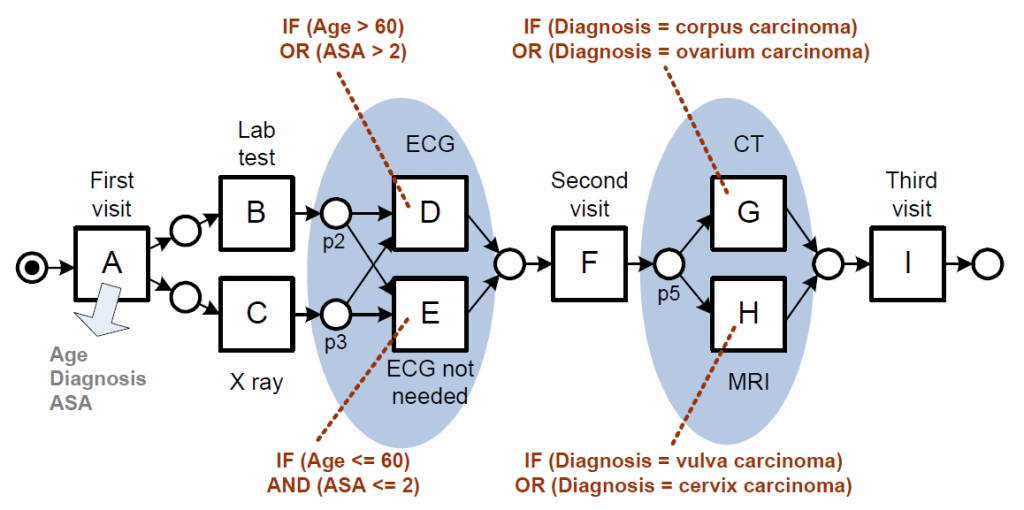
Fig. 4. Process model enhanced with decision rules
After establishing data-based rules for the overall process, the next step is to extract details about individual tasks within the process. This can be approached from two angles: performance, which focuses on temporal elements, and organization, which focuses on resource characteristics.
- Performance analysis
In performance analysis, three types of information are extracted.
- Execution times & waiting times: We can estimate the distribution of execution times and waiting times for each task based on event logs by calculating the mean and standard deviation. Typically, these distributions are assumed to follow a normal distribution, as depicted in the blue box in Figure 5.
- Case generation scheme: This scheme determines the interval of new case arrival. In the outpatient clinic example, this can be thought of as the time intervals between new patients arriving at the hospital. Here, the authors assume a Poisson distribution, commonly used in discrete event scenarios. The parameters of the Poisson distribution are estimated based on the average of time intervals between consecutive patient arrivals. This is represented by the red box in Figure 5.
- Probabilities for taking alternative paths: For each decision point, probabilities for alternative paths are derived from the historical data in the log and can be calculated as the ratio of the number of cases for a specific subsequent task to the number of cases for a prior task. For instance, in a process where Task B is followed by either Task D or Task E, the probability of branching to Task D can be calculated as below:

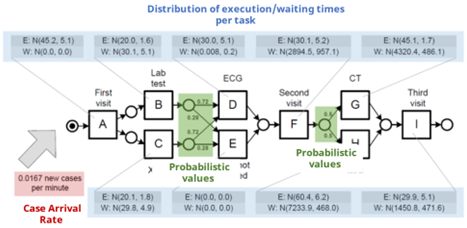
Fig. 5. Process model enhanced with performance perspective
- Role discovery (Organization)
The Role Discovery algorithm is a method for identifying groups of workers who perform similar tasks based on their profiles. In this context, a profile refers to a vector that represents how frequently an individual worker performs specific tasks. For example, in Figure 6, Claire and Jo’s profiles are represented by highlighted rows, from which we can see that both perform the “Lab test” task only. Consequently, we can conclude that they share the same role based on the similarity in their profile vectors.
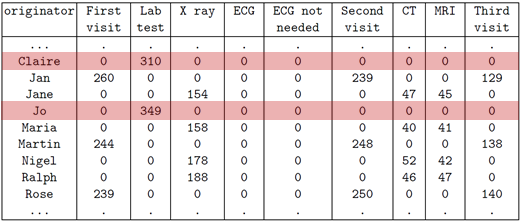
Fig. 6. An originator by activity matrix showing how often each resource performed each activity
The authors use Pearson’s correlation coefficient, ranging from -1.0 to 1.0, to measure the distance between profiles. In this context, negative correlations are removed, and individuals with a strong positive correlation are grouped into the same role. Figure 7 illustrates the outcome of mapping workers into clusters based on their primary tasks. In the outpatient clinic example, workers are grouped into a total of 5 different clusters.
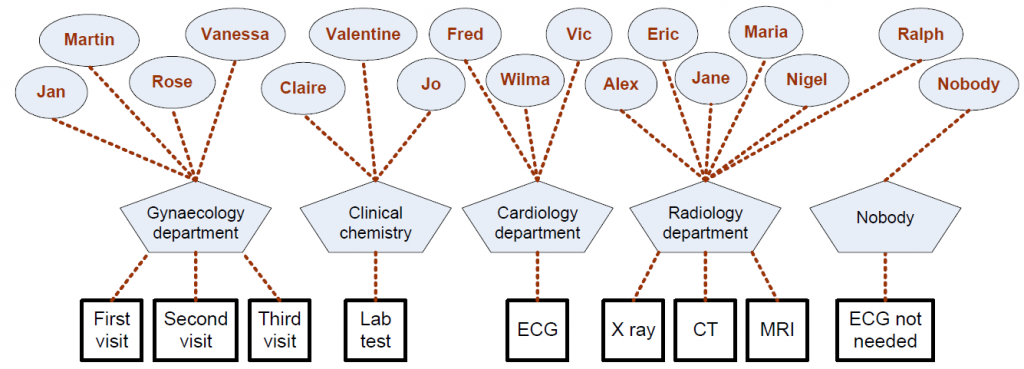
Fig. 7. Process model enhanced with organizational perspective
How to perform what-if analysis
With the extracted pieces information, we can now construct an integrated process model for simulation. But how can we achieve this integration? Simply running a simulation with the existing data wouldn’t make much sense, would it?
It’s time to apply the specific scenarios you want to analyze to the simulation model. For instance, in the case of an outpatient clinic process, you could experiment with increasing the number of doctors, adjusting the daily patient intake, or even predicting the time it takes to complete treatment for patients who haven’t finished all their medical procedures yet. In what-if analysis, you can come up with various hypothetical scenarios for process improvement. After adjusting the options related to the desired scenario, the simulation engine begins to generate a virtual event log.
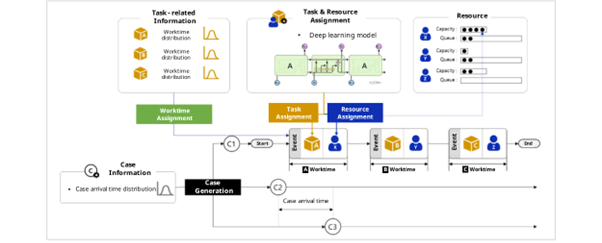
Fig. 8. Simulation engine structure
Figure 8 depicts the process in which the simulation engine generates logs. First, it creates virtual cases. The time intervals between these cases are randomly assigned using the case arrival time distribution derived from the data. Next, the deep learning model assigns tasks and resource to each case. It then randomly generates worktime for each task from the worktime distribution. If the assigned resource’s task list becomes overloaded, exceeding their work capacity, the tasks get queued. This process is repeated until all cases have completed all tasks. We can better understand this process with the help of an animation.

Here, a black circle represents an individual case, and the blue rhombus symbolizes a task within the process. The cases stacking up in a line indicate that the tasks are being queued due to an influx of work exceeding the capacity of the resource responsible for those tasks.
Simulation Analysis with ProDiscovery
After generating virtual logs through the simulation engine, the next step is to analyze its effectiveness in comparison to real-world data. ProDiscovery offers a robust simulation analysis dashboard which allows you to juxtapose a baseline model against various scenarios using process maps, case count, event count, lead time, cost, worktime, and other KPIs. The blue elements pertain to the base model derived from original data, while the pink elements pertain to the simulation logs. With ProDiscovery, businesses can not only test hypotheses, but also refine simulations, fostering a culture of continuous improvement that keeps them agile and competitive in today’s dynamic landscape.
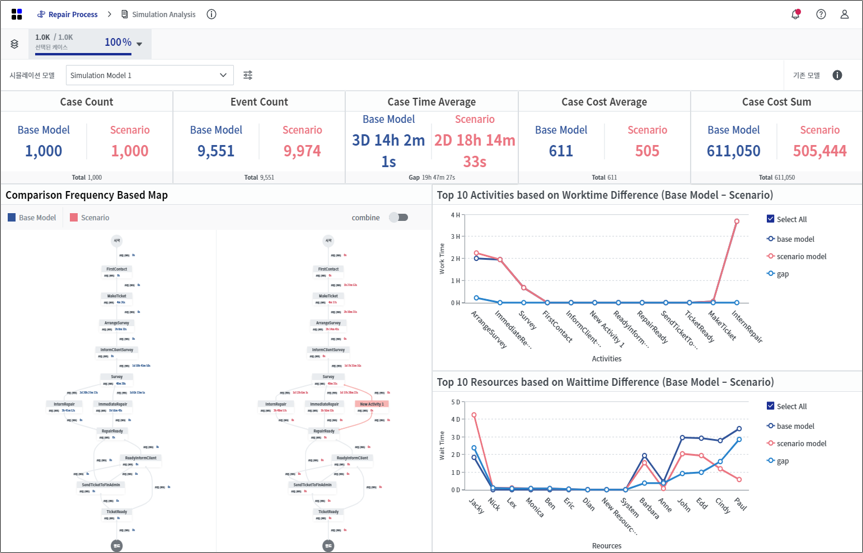
Fig. 9. Simulation engine structure
Conclusion
Simulation analysis stands as a powerful tool for process improvement. It enables us to explore various scenarios, optimize workflows, and evaluate the impact of changes in a risk-free virtual environment. By extracting key information from data, businesses can refine processes, enhance efficiency, and ultimately drive operational excellence. Simulation analysis is a dynamic bridge between current processes and future possibilities. Start transforming ideas into actions today with ProDiscovery.
Reference
Rozinat, R.S. Mans, M. Song, W.M.P. van der Aalst, Discovering simulation models, Information Systems, Volume 34, Issue 3, 2009, Pages 305-327, ISSN 0306-4379, https://doi.org/10.1016/j.is.2008.09.002.
#퍼즐데이터 #프로디스커버리 #프로세스마이닝 #PuzzleData #ProDiscovery #processmining #프로세스인텔리전스 #ProcessIntelligence #RPA #BPM #BI #datamining #디지털트랜스포메이션 #디지털혁신 #프로세스혁신 #digitaltransformation #Webinar #업무혁신 #TaskMining #태스크마이닝 #고객여정 #프로세스분석 #데이터분석 #프로세스개선